
This post is by Mike, Vice President of Obfuscation and Delay here at PrairieHaven.
Basic information (FAQ)
The solar panels are mounted in two arrays, a 14kw ground-mounted array in front of the house and a 7kw roof-mounted array on the garage. Unfortunately, the way the roof of the house is constructed (structural insulated panels) makes it unsuitable for mounting solar panels.
They’re SolarWorld 280 watt panels, feeding SolarEdge optimizers and inverters. There’s battery backup (about 60 kwh), but this is a grid-connected system that treats the utility company like a really big battery because our surplus power is WAY more than those batteries can hold.
Results
We thought system would generate slightly more power than we use at the farm (and charging the car), over the course of a year. We knew that we would produce a lot more than we use during the summer months, but that it would balance out in the winter months. The goal was “produce as much power as we can” and “net zero.”
As of this update , the system has been in for almost 10 years and we produce quite a bit more power than we use. Which is fine, because that excess production can offset some carbon from somewhere else. But a person on a more careful budget might be able to install a smaller system and still get to net zero.
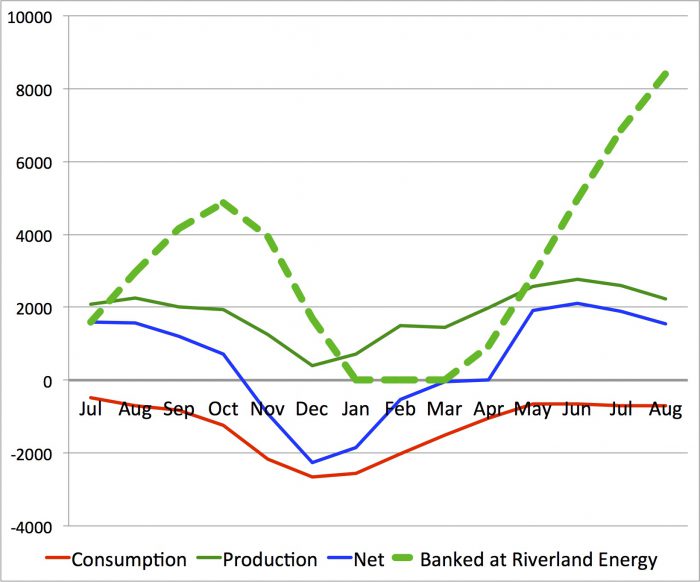
Here’s a graph that shows the results during the first year or so. The amount of power that’s in our bank at the power company is quite a bit higher this year because we commissioned the system in mid-summer last year so we only built about half the bank that we will this year. Since we nearly made it through the winter months on a bank of about 5000 kwHours, we’re going to have quite a lot of power to spare this coming winter.
[UPDATE – March 2024: – roll down to the “Monitoring” section at the end of the page to see an updated version of this graph a couple years after we’d started — 2017 — and a little more detail about where these numbers come from — I’ll get caught up on the graphs when I finally get a round tuit].
Installation
Design and installation was done by Next Step Energy, Eau Claire, WI. Great job.
The team
I asked for a group photo. This is what I got. There’s Deep Meaning here, I think.
Zeus, Rich, Hickory, Travis (in front), Evan (on the array). Rich definitely gets shortchanged by the photographer of this blog post. Sorry about that.
Installation project and the first day of generating power
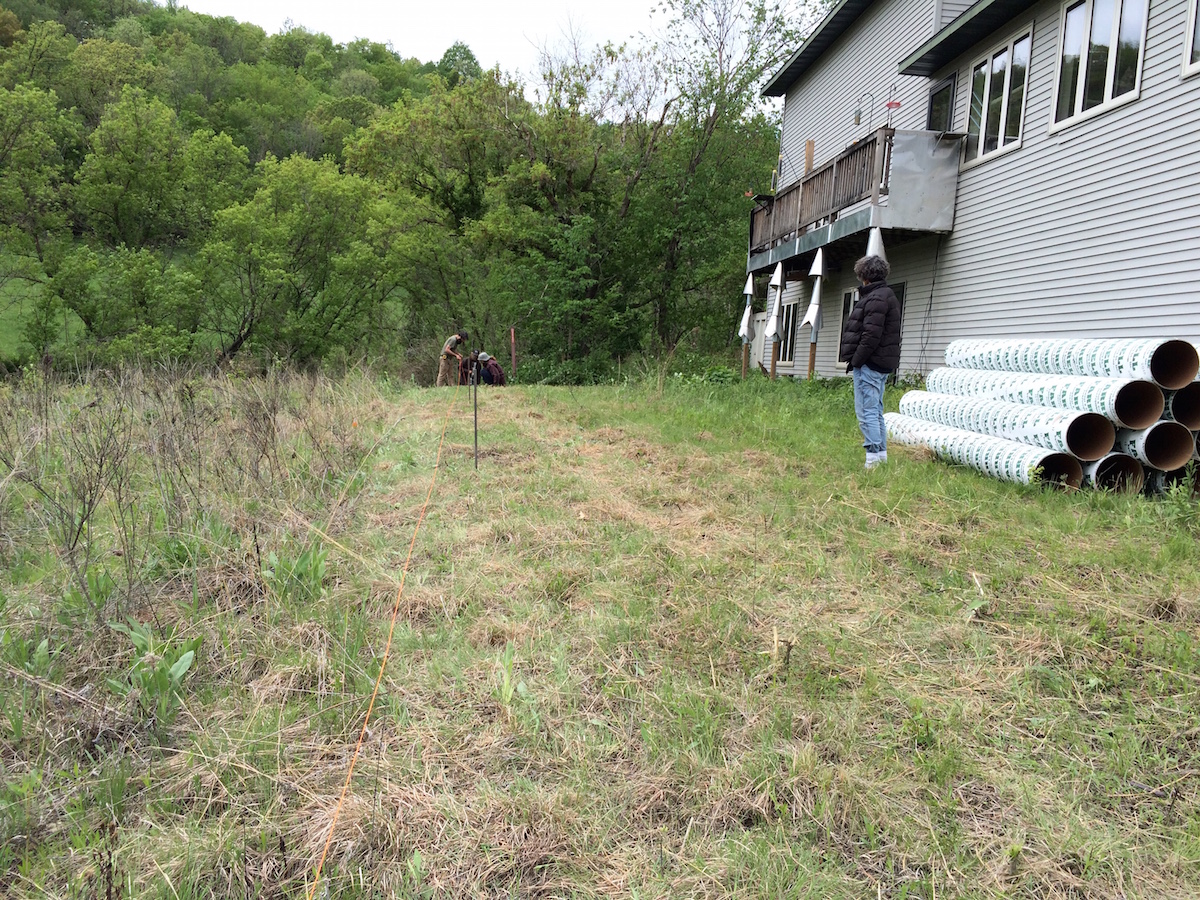
The story of solar panel installation here at Prairie Haven begins in May of 2015 when Zeus, Hickory and Travis show up with the tubes for the concrete and start laying out where the foundation of the array will go…
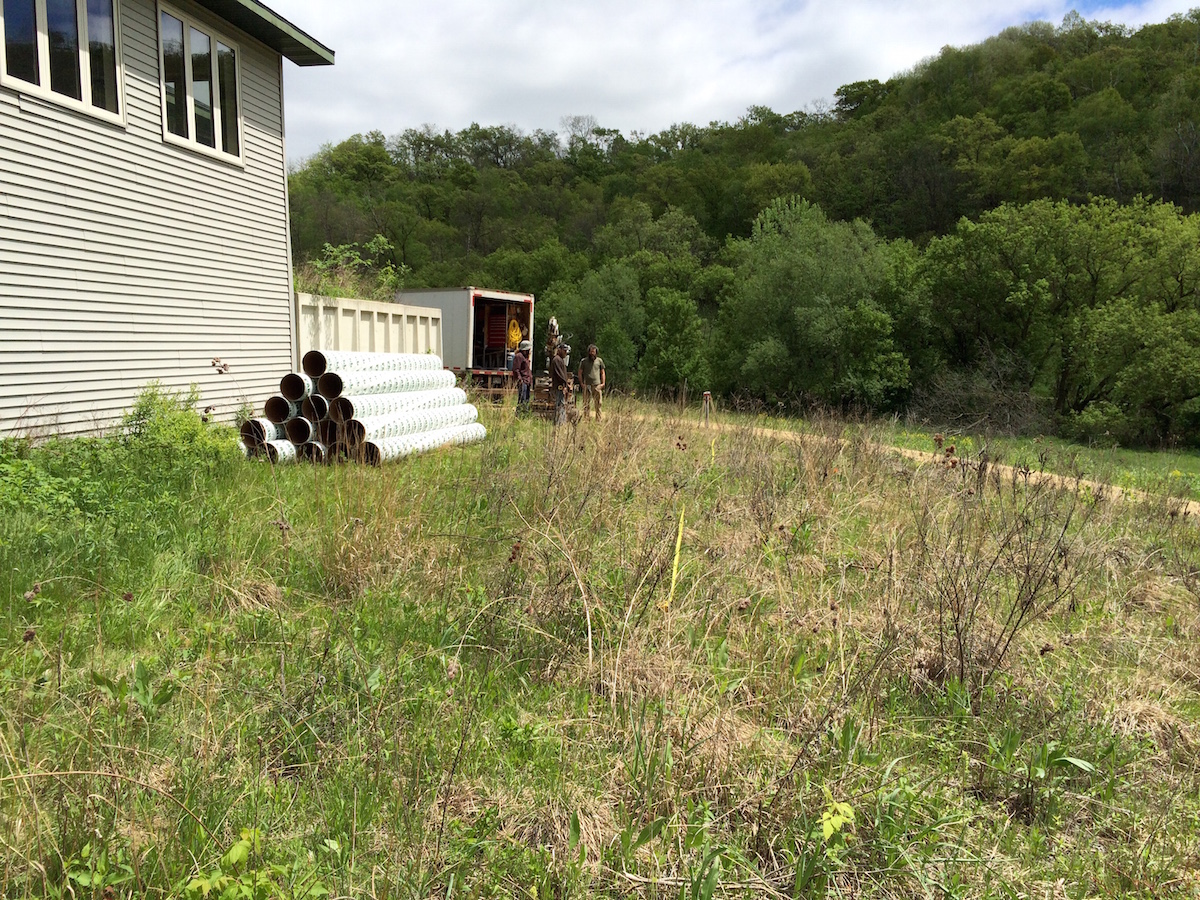
Here’s the first step — setting out the string lines for the holes where the concrete posts will be. Since this array is subtracting some of the prairie that Marcie struggled to introduce in front of the house, she’s keeping a close eye on where it’s going.
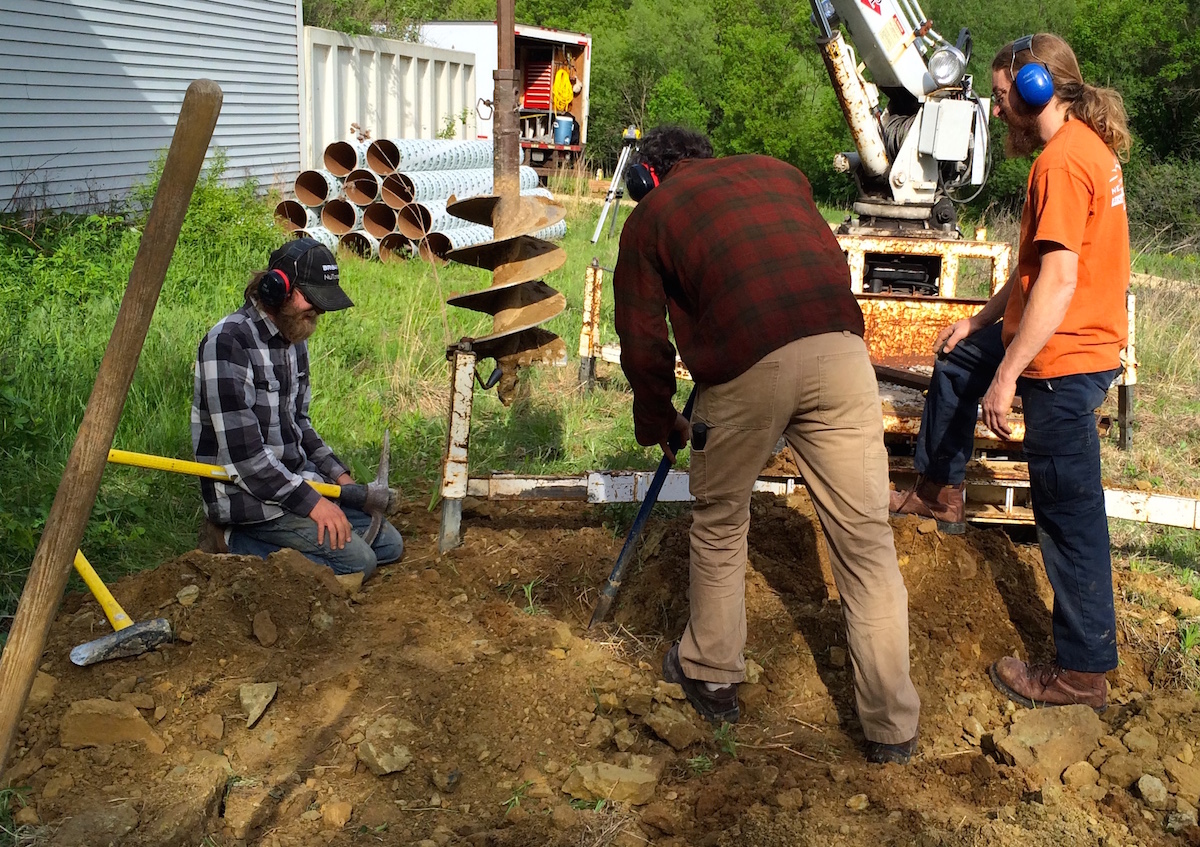
With their cool auger (see below), I was thinking that digging the holes for the concrete posts would be easy. That is until they started digging and discovered…. rocks. Lotsa rocks.

Rocks that did not like to be disturbed. Here are Travis, Zeus, and Hickory taking turns bashing away on them. I contributed that steel spud that Zeus is using, and lots of bad advice.
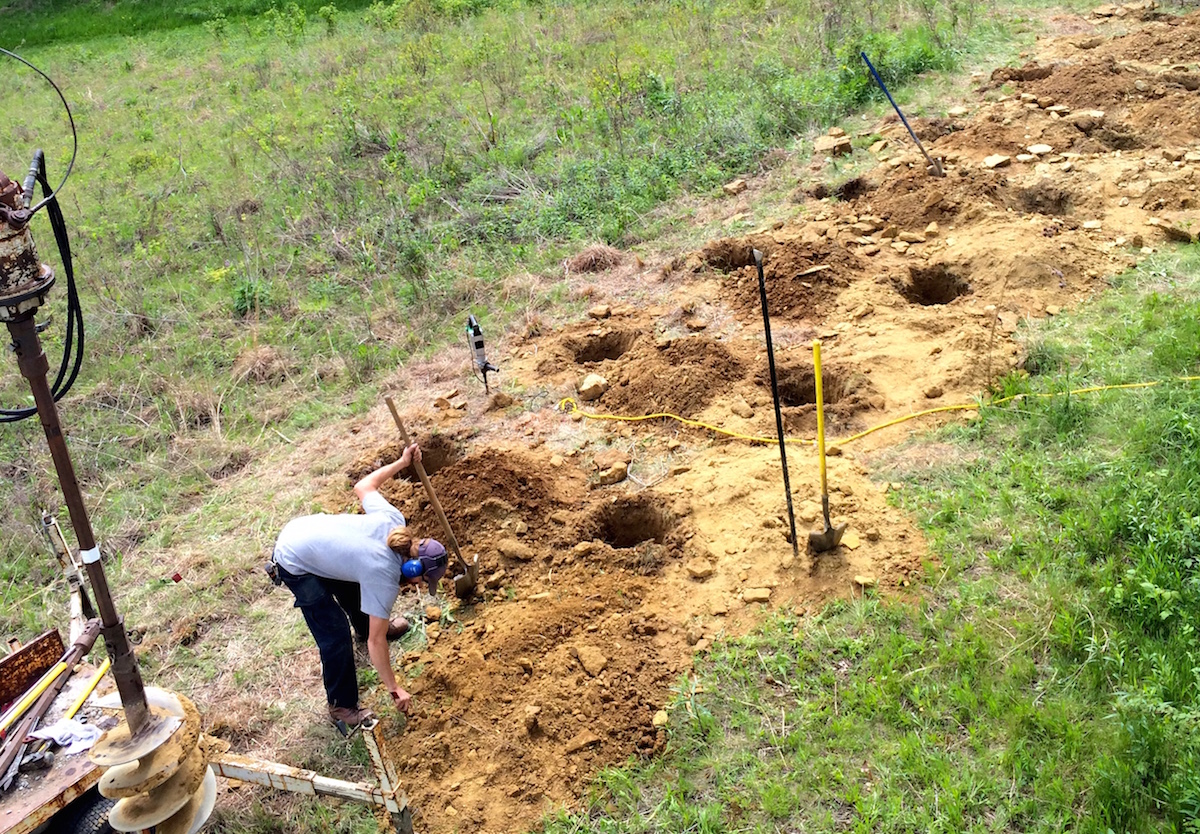
Time passed and the twin rows of holes started to take shape. The weather also started to warm up. Hickory and Travis lost a lot of weight. I maintained a safe distance from anything that resembled work.
The locals started to drop by to have a look at the equipment and the project during down times. This deer was just as interested in the hole-digging auger as I was.

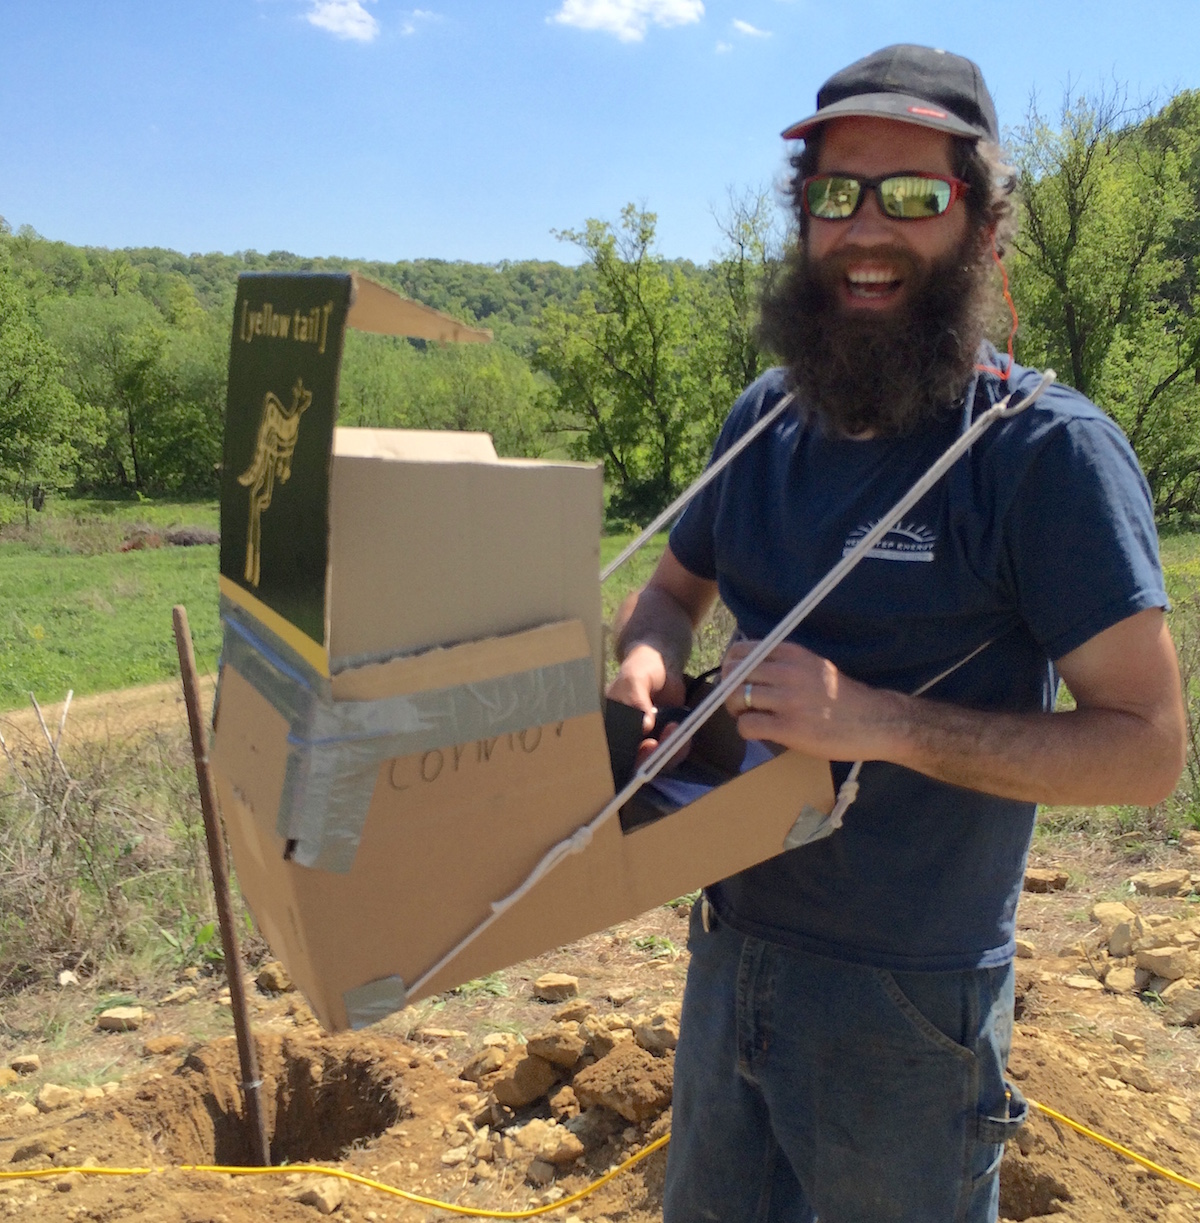
Along the way we shared technology tips. I offered my drone-flying shroud as a mechanism for Zeus to support his auger remote-control gizmo. He wasn’t as impressed as he looks in this photo.
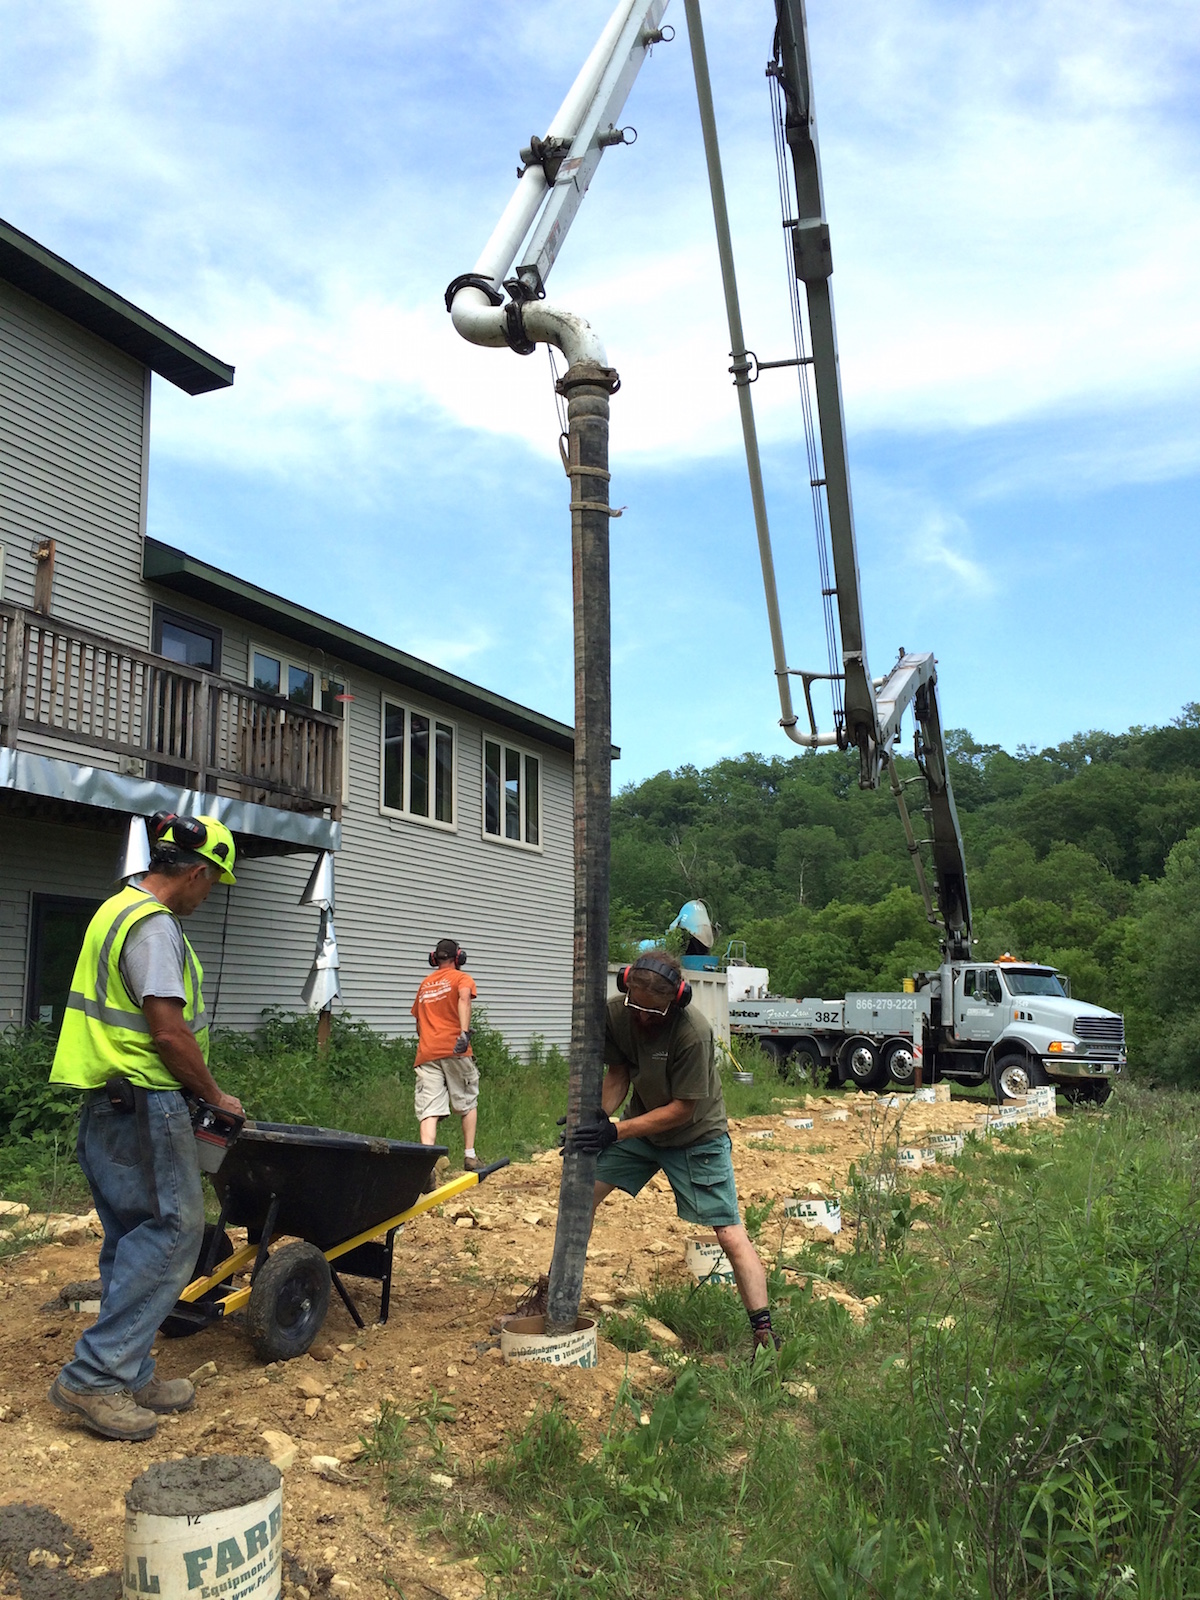
Eventually digging was done and the cement-pumper gizmo showed up.

The race was on. Hickory and Travis were trading jobs like crazy to keep up with the madman who was running the cement pump. Here they all are, in action.
This butterfly dropped by to sample their work, while it was still in progress.

In what seemed like about 15 seconds, the whole pour was done. Hickory was wearing a fair amount of cement by the end.

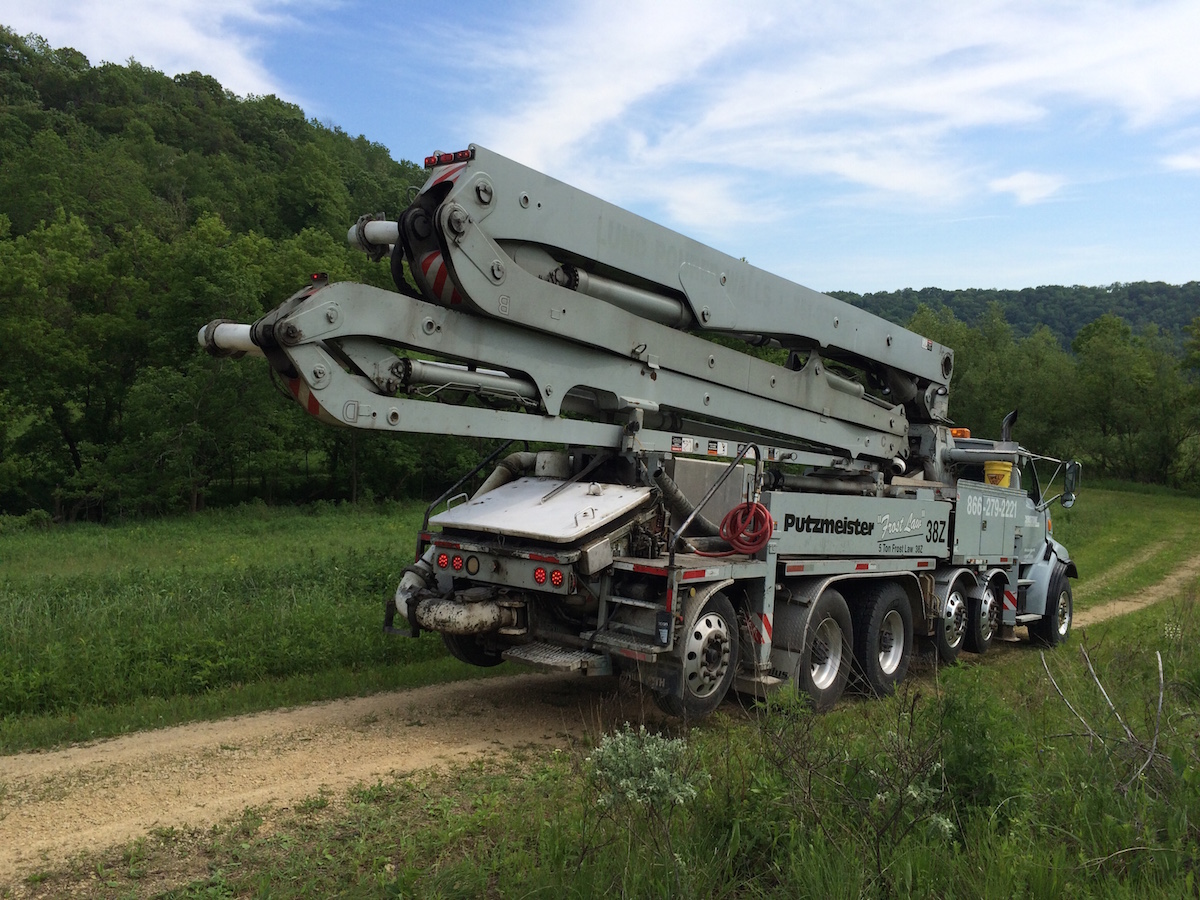
Here’s a shot of the pumper as it is heading out. I want to meet the person that named this thing.
Next came a pile of solar panels and building the frame for the racks.

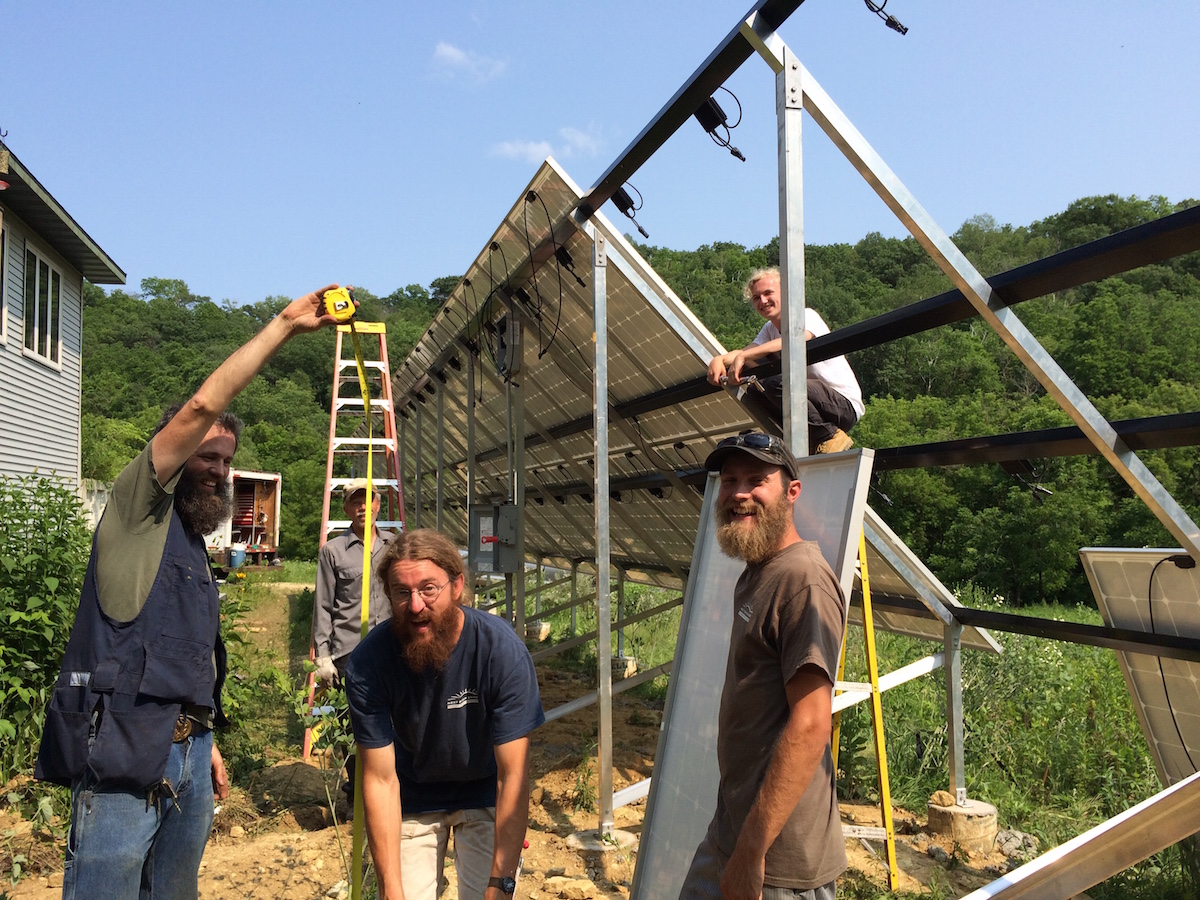
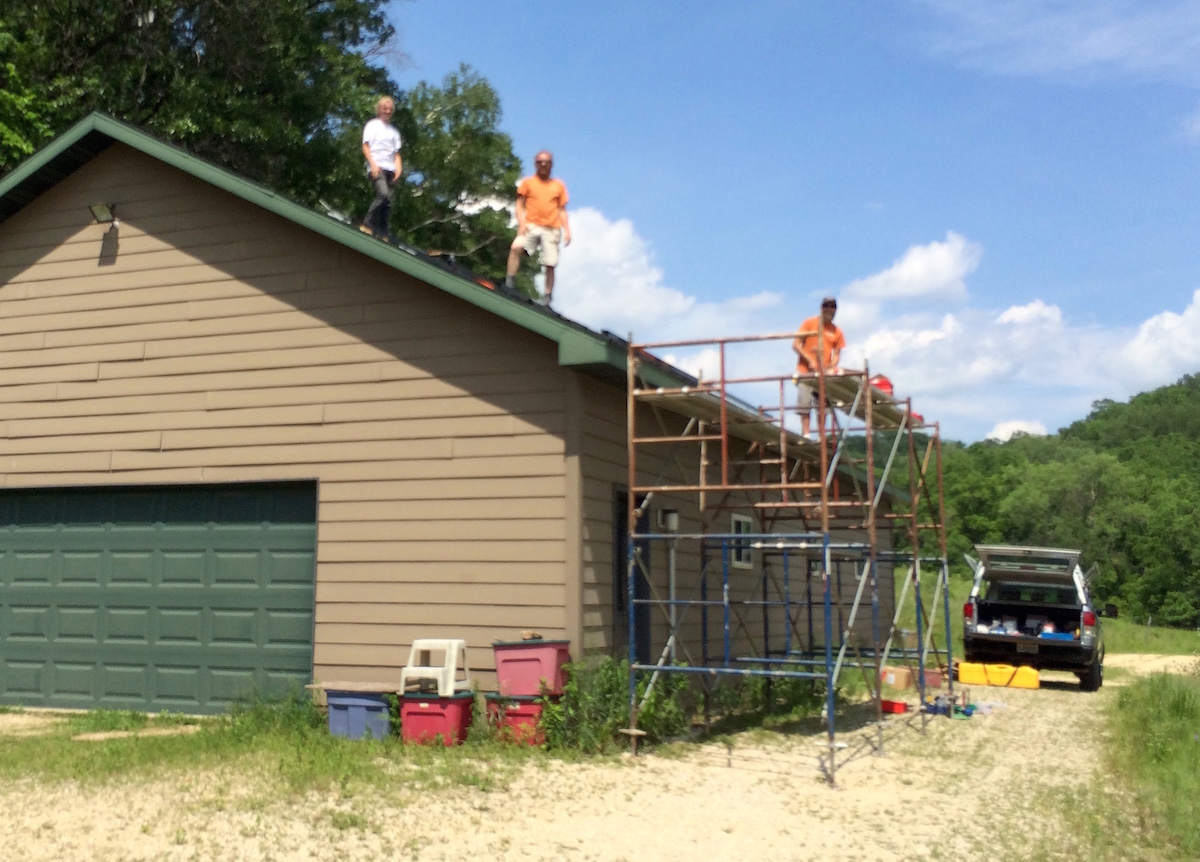
Attention shifted to the top of the garage, where a second set of panels were going to be installed. Here again, the focus is on putting the racking in place. Evan, Hickory and Travis star in this horrible photo.
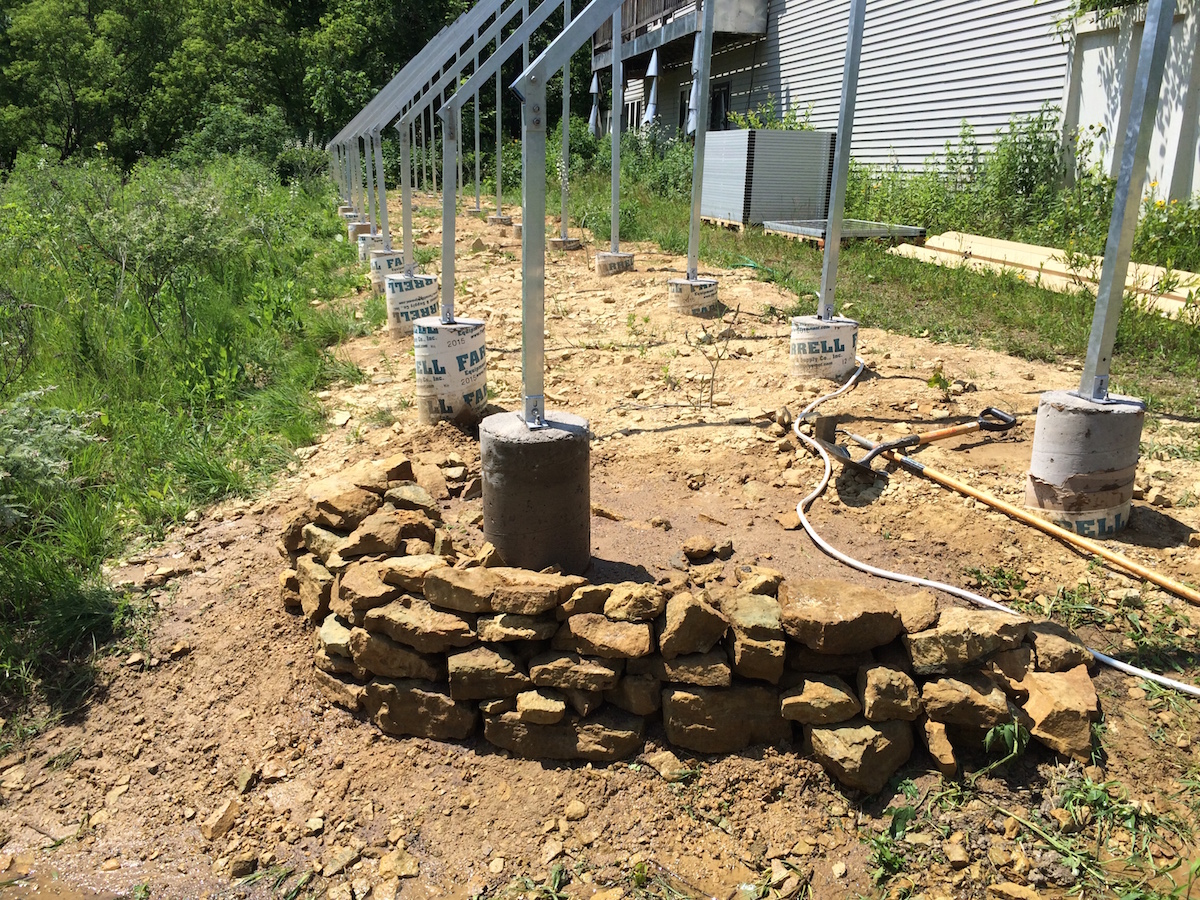
Meanwhile, I read a bunch of stuff on the net and tried my hand at building a little retaining wall around a post that needed a little berm. A great use for some of those ding dang rippin’ frippin’ rocks.
Here are all the panels mounted — note how straight they are — that row of panels is about 80 feet long, pretty dang straight in my view.

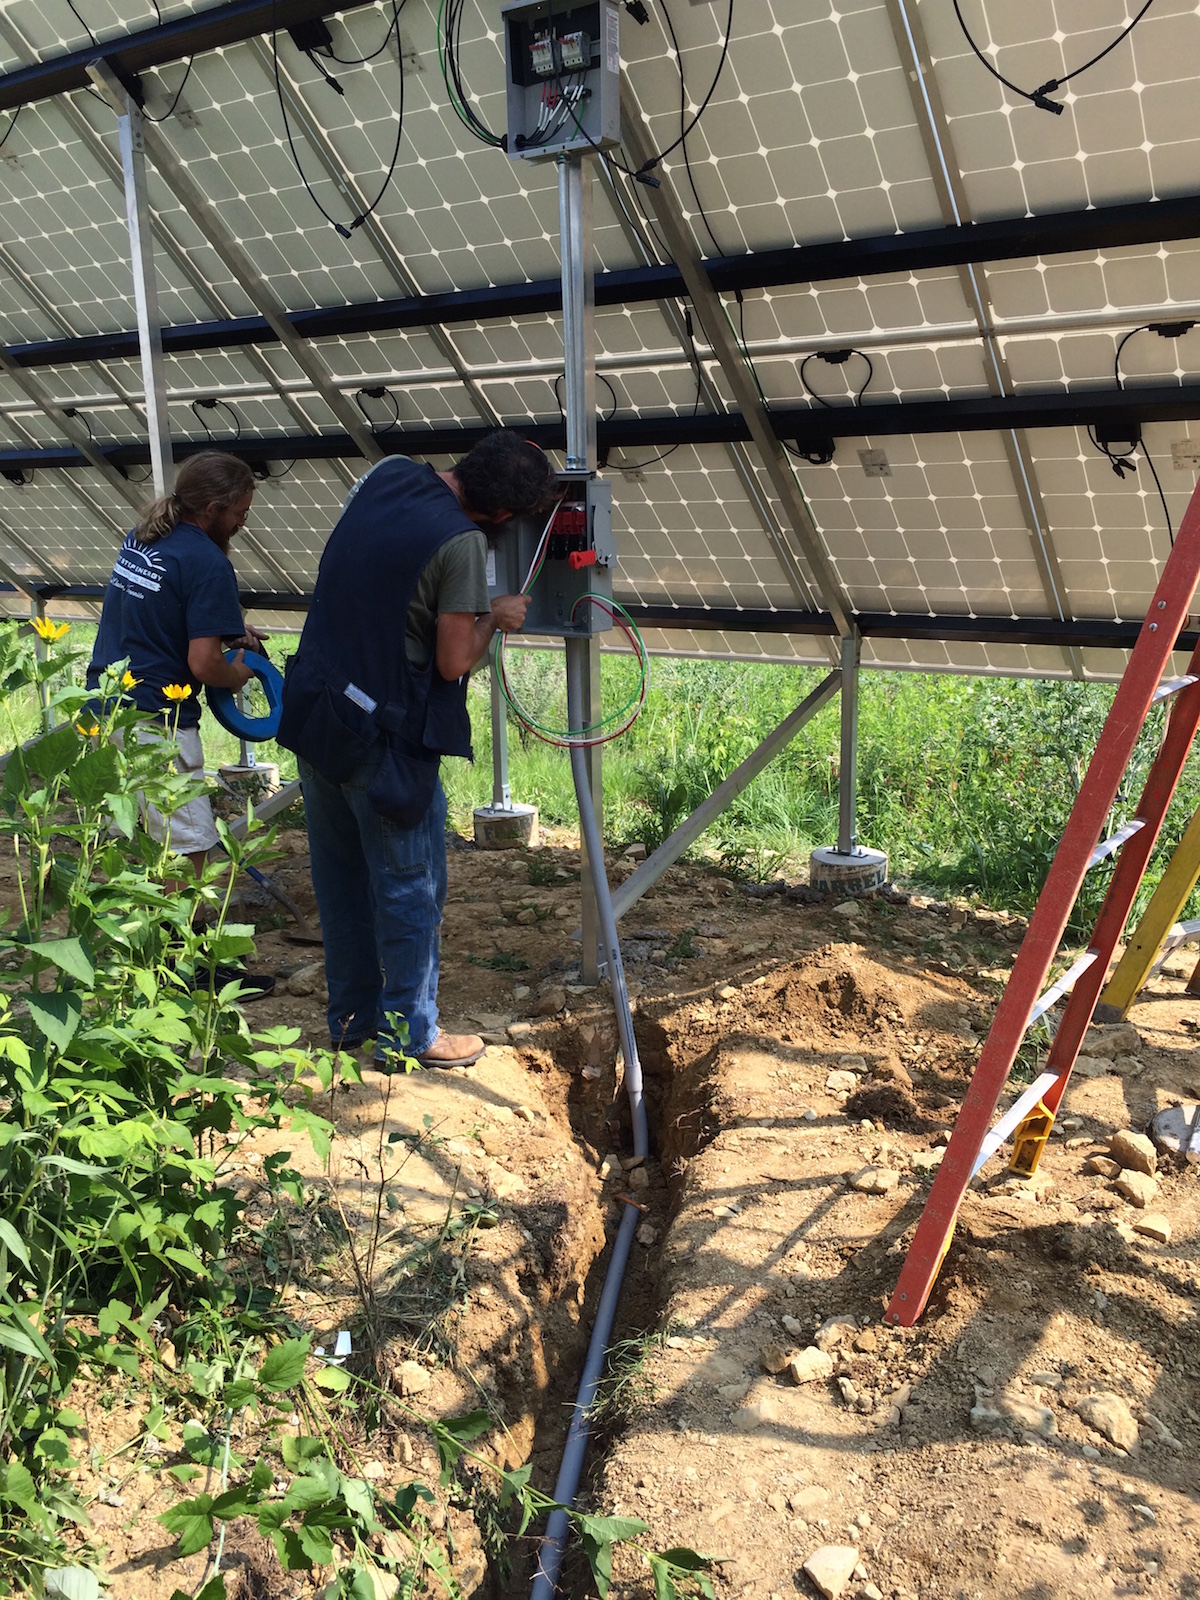
Here’s Zeus wiring up the disconnect. Have a look at Evan’s Trench. Did I mention rocks? Evan ran into a few of them digging this trench too.
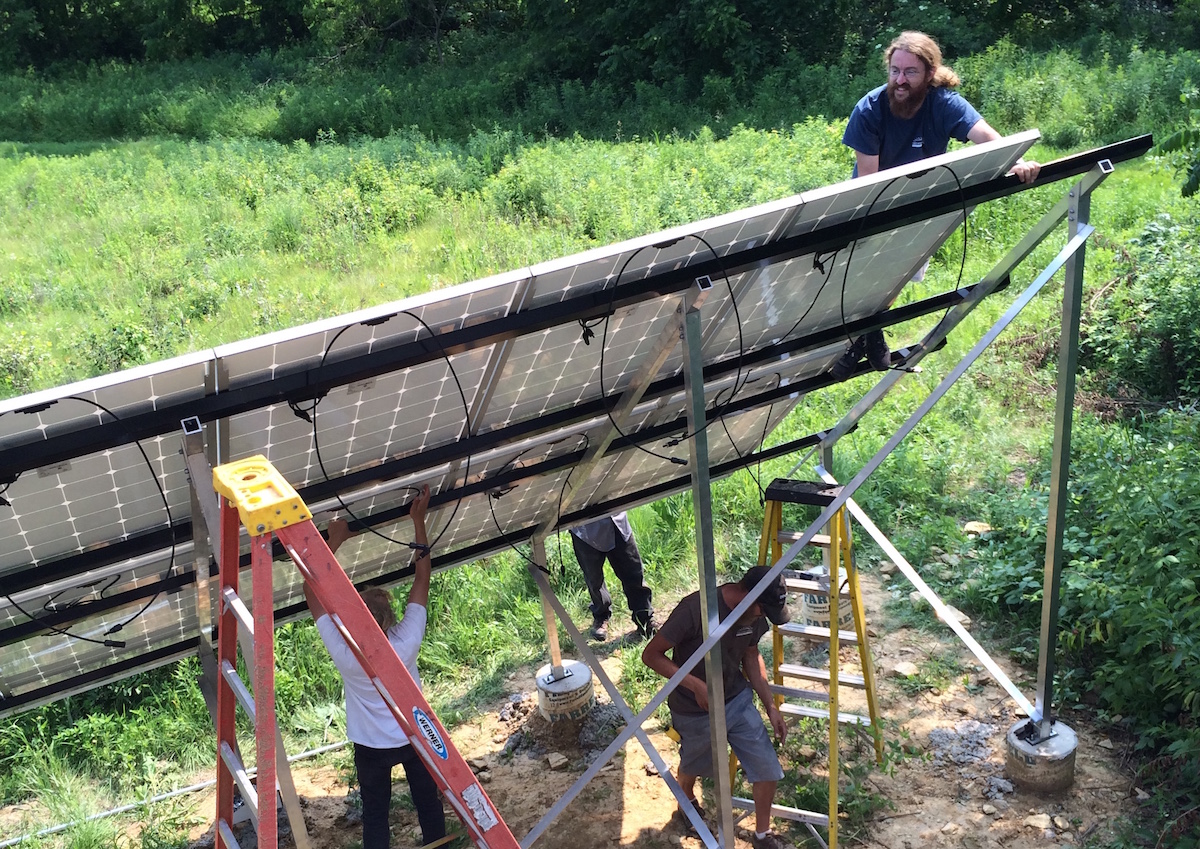
An action shot, setting the last panel of the big array. A big milestone. I was slowing work down by calling out irrelevant observations from the deck above them. Evan, Rich’s feet, Travis and Hickory are featured. See? Rich never catches a break in the photos dept.
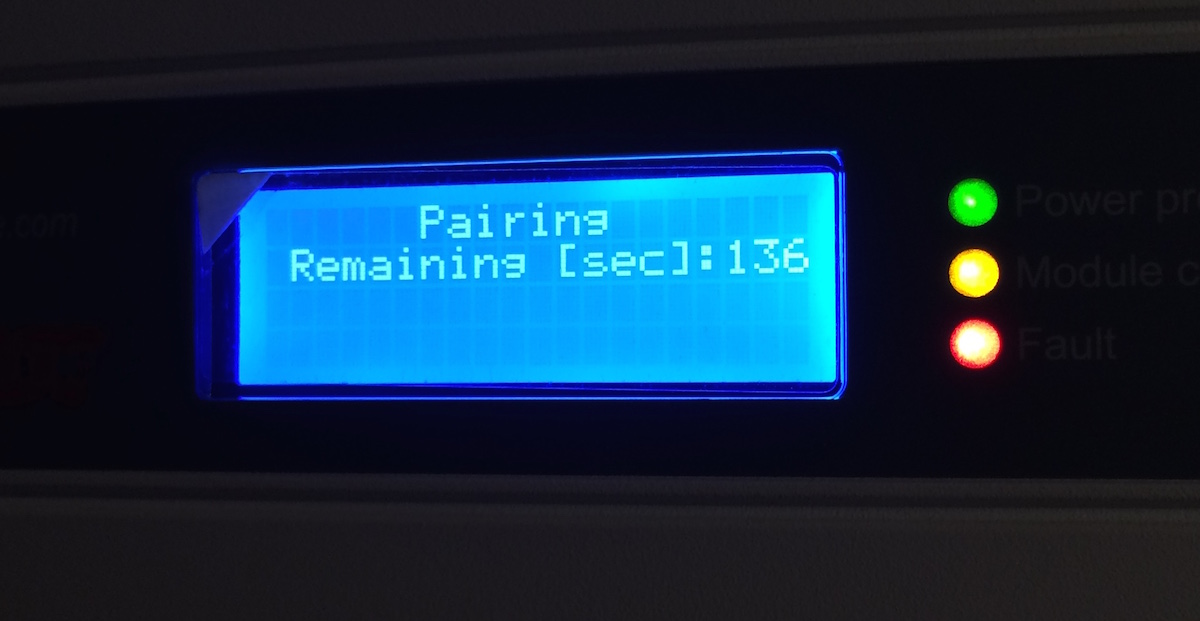
A big moment came when they turned the main array on for the very first time. Here’s a picture of the inverter as it’s discovering the optimizers attached to each of the solar panels.
And here’s a picture of the two arrays later that evening. First Power!
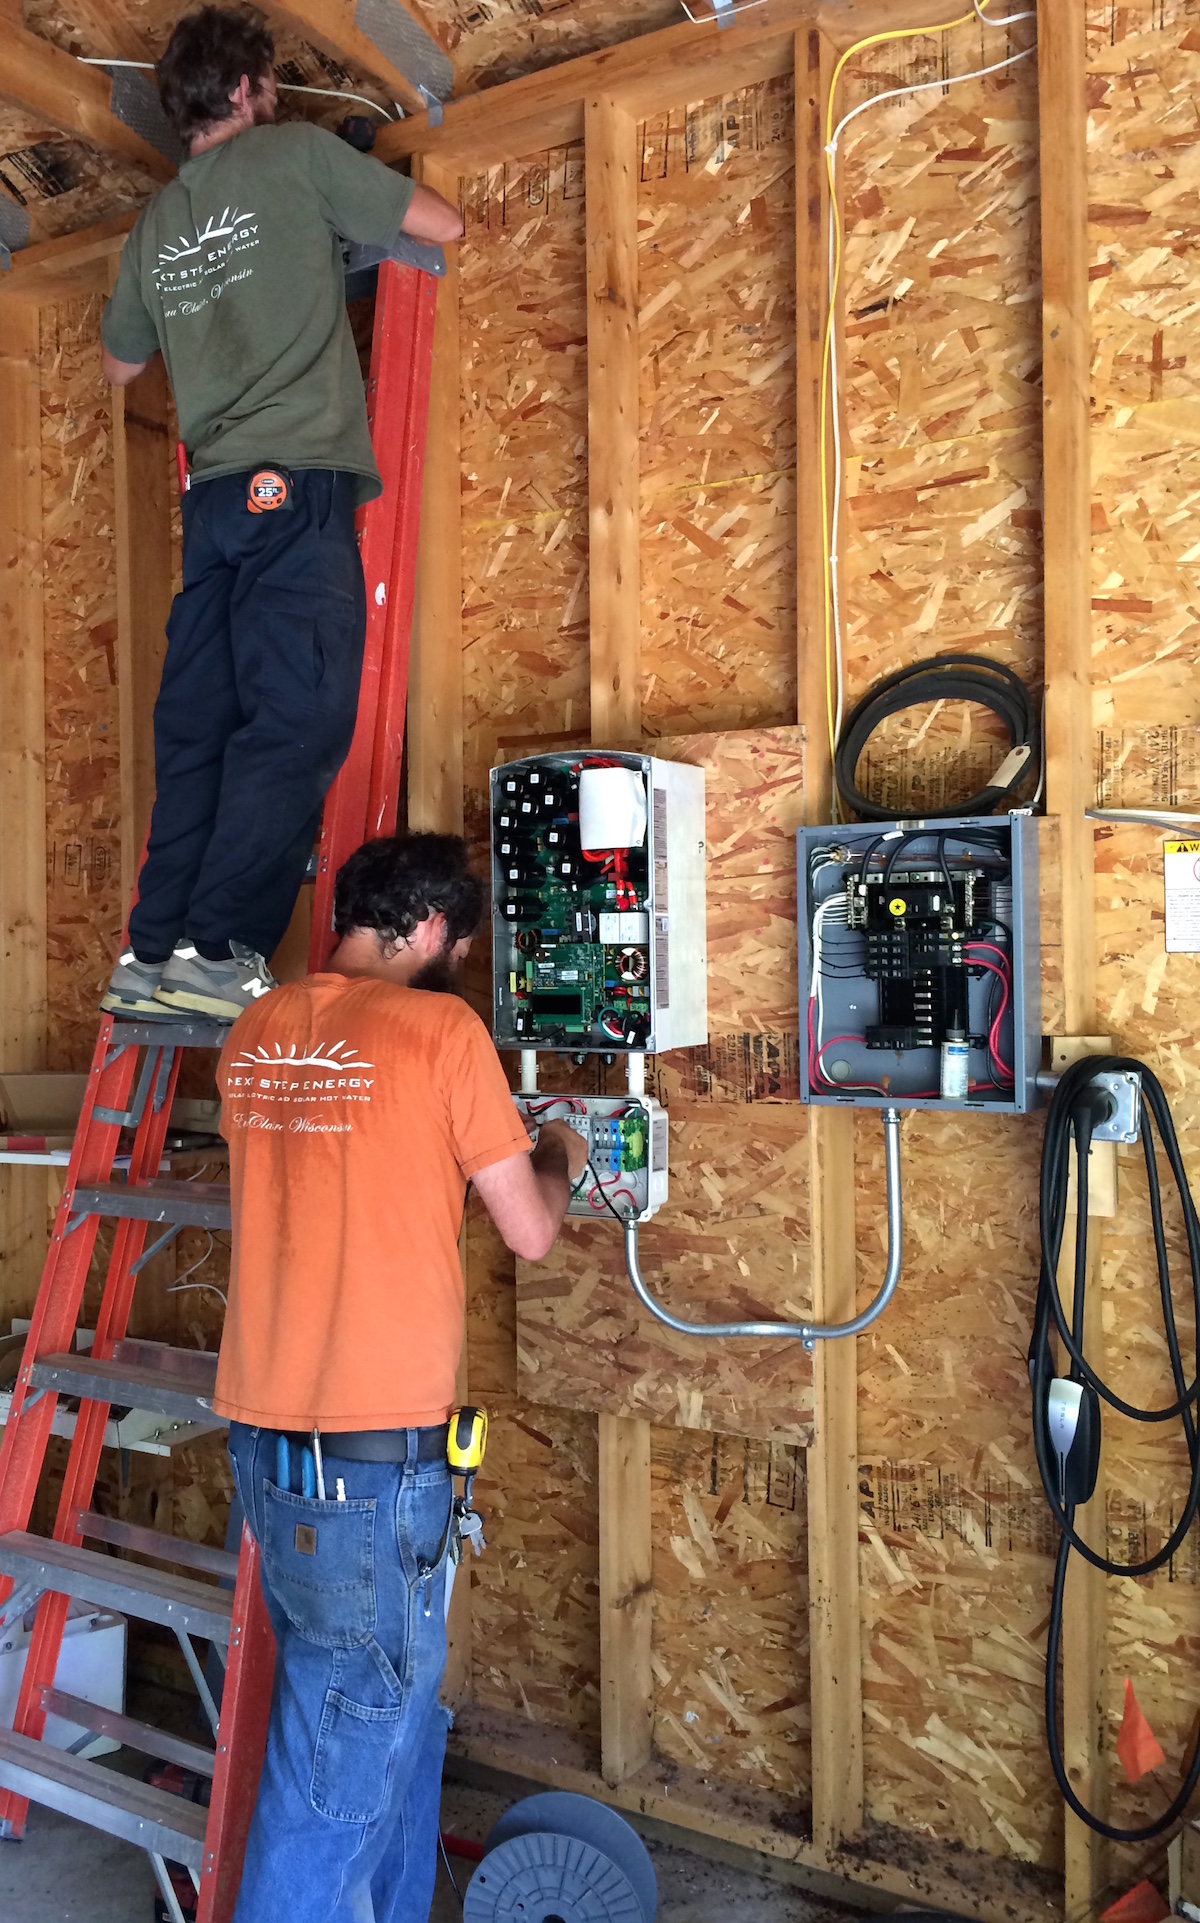
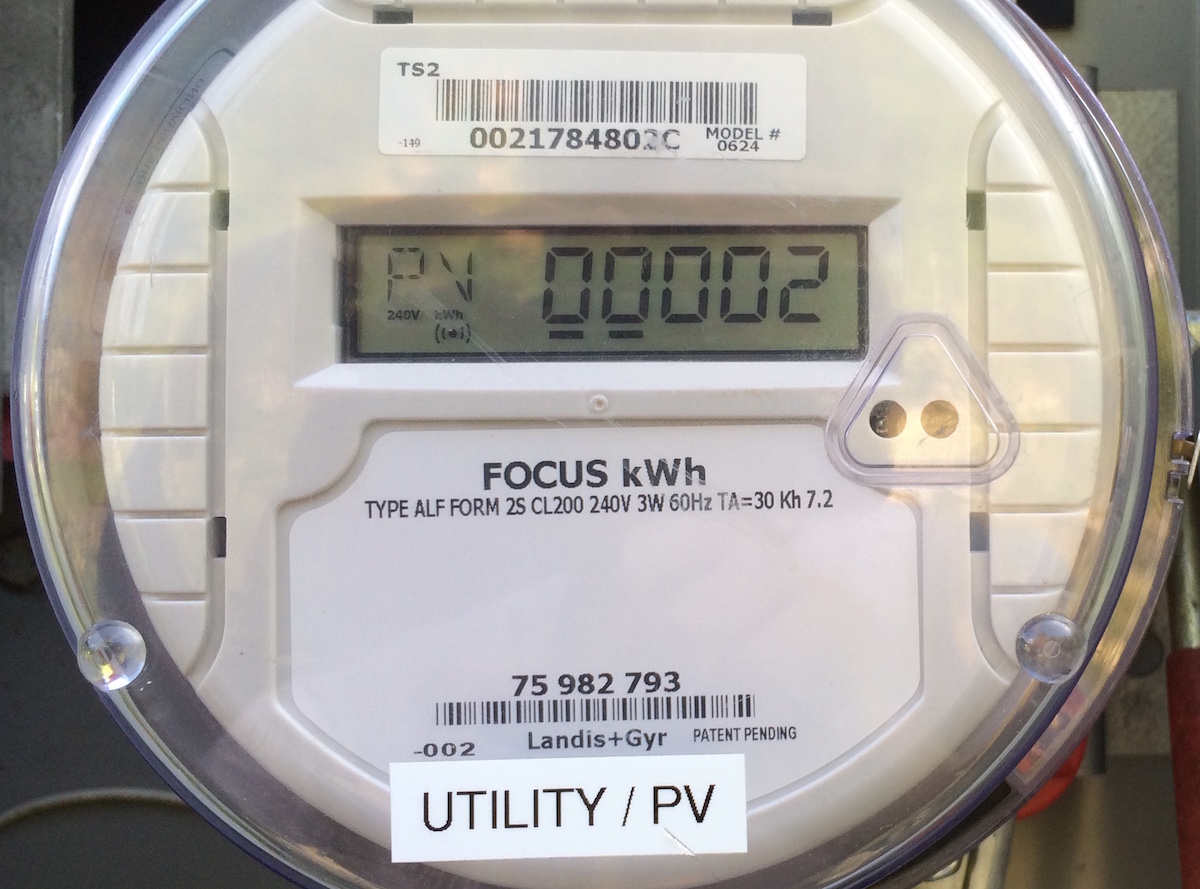
The final wiring of the Garage Array was done on a tight deadline — the folks from Riverland Power Cooperative were showing up that afternoon to swap in a new meter (which added the capability to differentiate between the power we generate vs power we consume from Riverland). Here are Zeus and Hickory trying to work while I distract them with off-topic conversation. They made it, with only a minute to spare, no help from me.
Note the 240 volt outlet for the Tesla car-charger gizmo on the lower right.
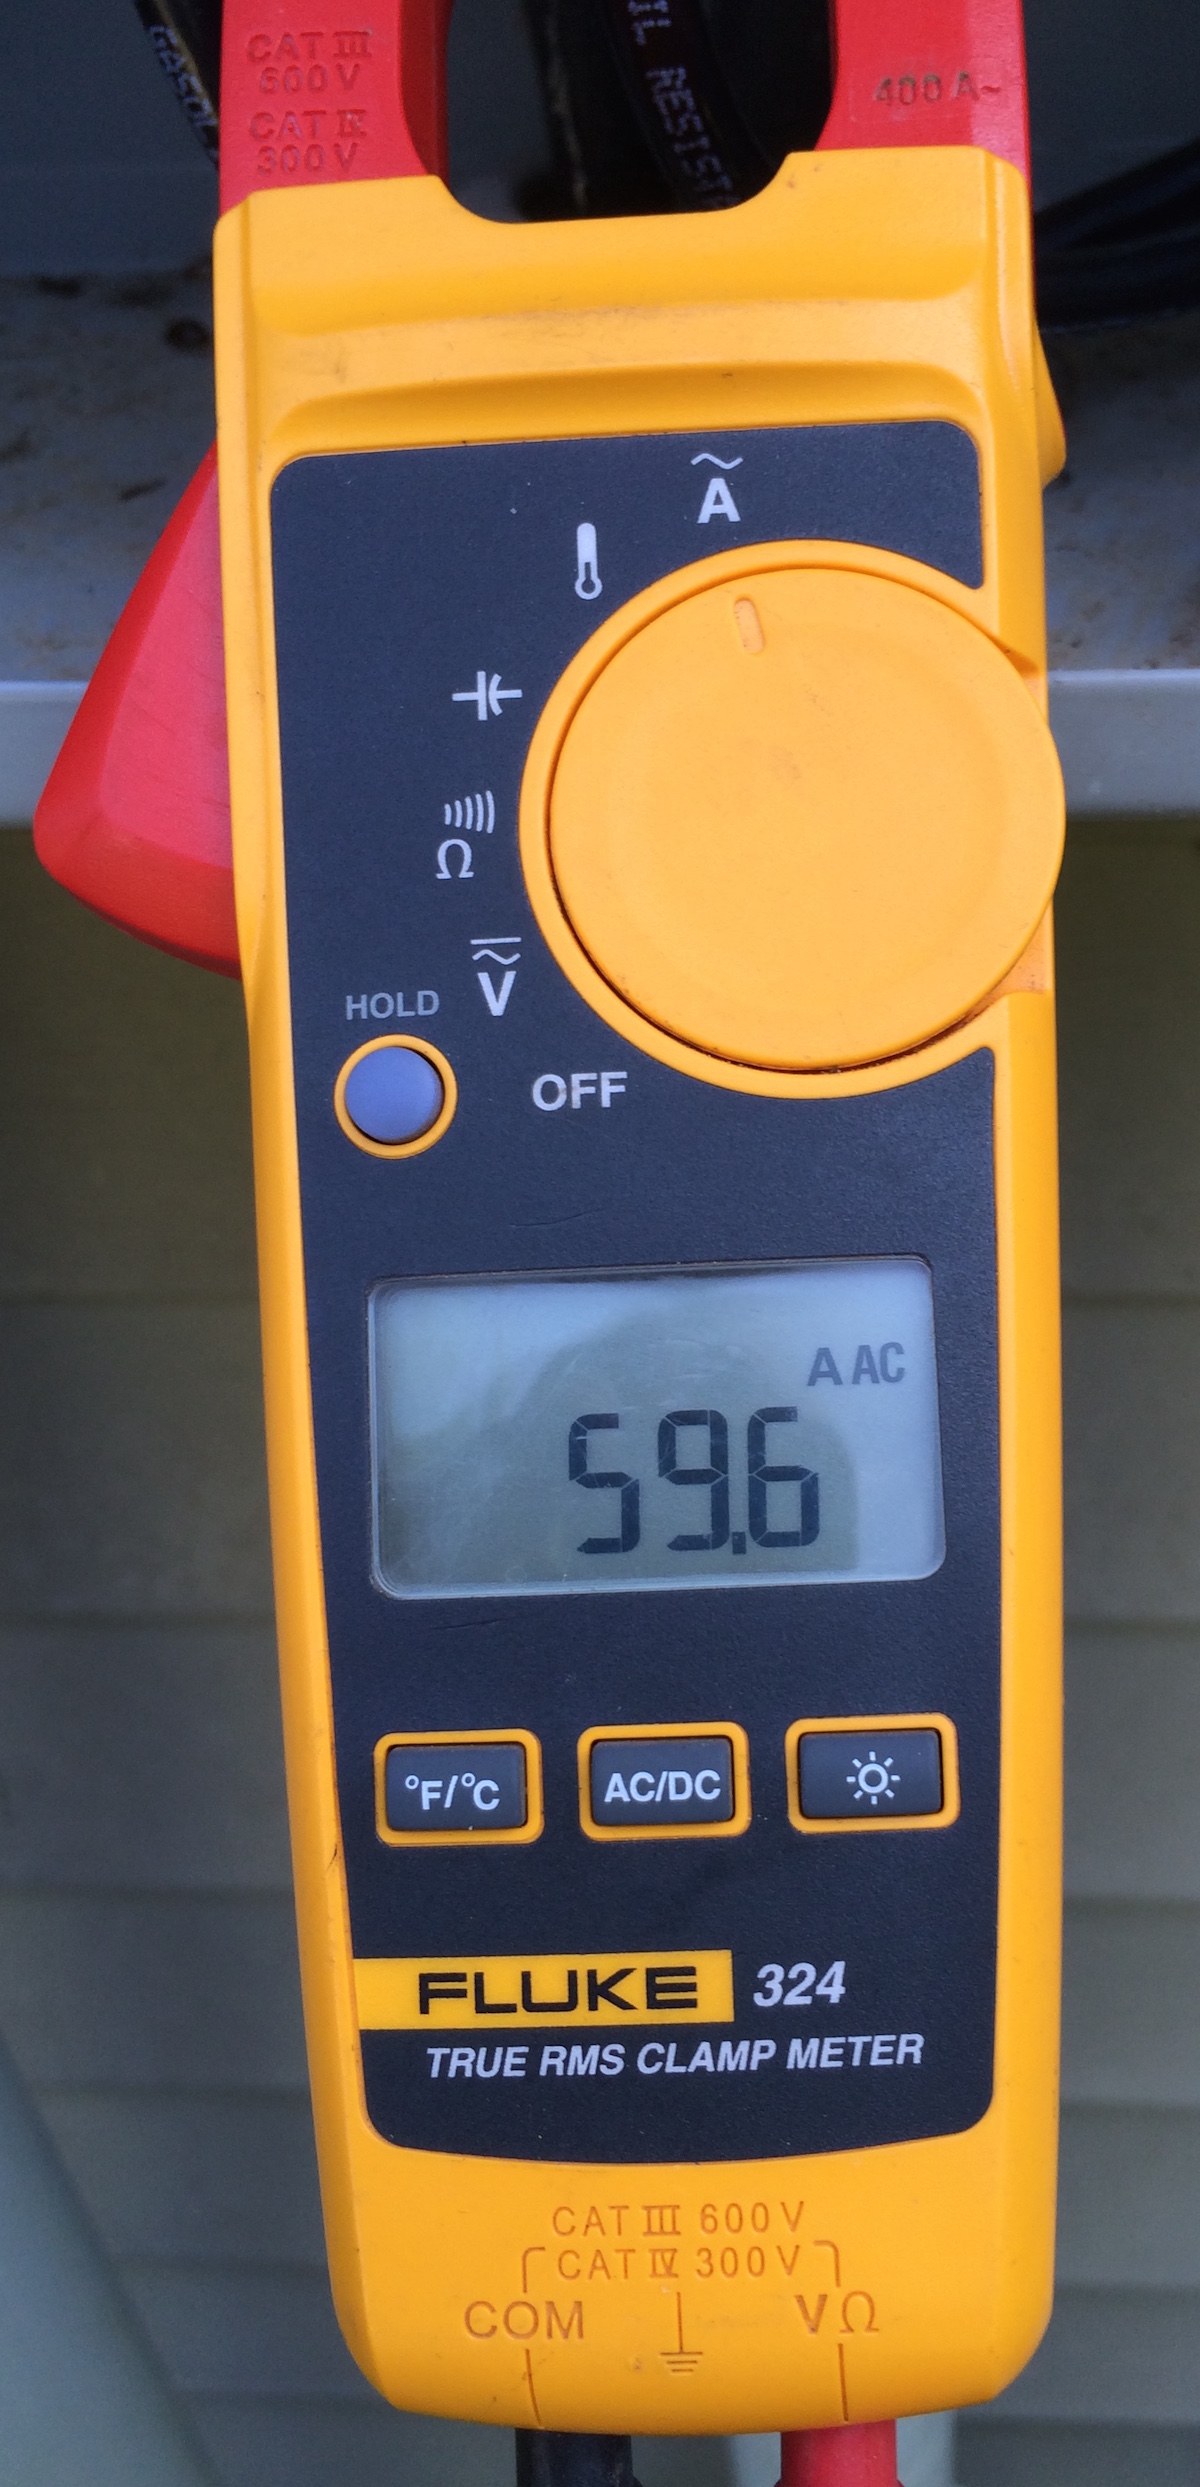
Here’s the ammeter showing our first “real” amps! At the new meter! Woohoo! 59.6, by the way, is a lotta amps — at 240 volts, that’s 14.3 kilowatts. Would have been plenty to charge the car and run the house at the same time. This was taken just before the system passed the test that allowed it to be certified and commissioned.
Dang! I missed taking the picture of our first kilowatt-hour. Here’s a picture of our second one.
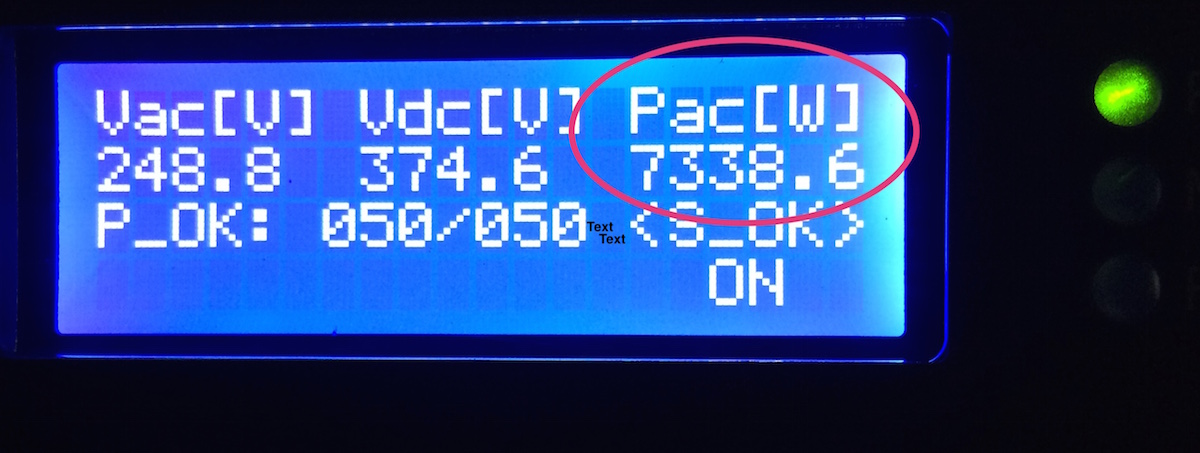
Here’s are two pictures that show how efficient these arrays are. This first one shows how oblique the angle is between early-morning sun and the main array — the sun is just barely hitting the array. And yet…

… the panels in that array are already producing over 7 kilowatts of power (the array is rated at about 13.5 KW when the sun is hitting it straight on). These systems have come a LONG way since my first one.
And we’re off! I’m really pleased with the way this project went. The final result is quite undramatic. The panels just work. More updates as we get more experience. Update, March 2024: they still just work.
Monitoring
We have three sources of power production and consumption data — the monthly bill from Riverland Power, the monitoring that’s built into the Solar Edge panels and inverters, and a couple of eGauge meters on some key circuits.
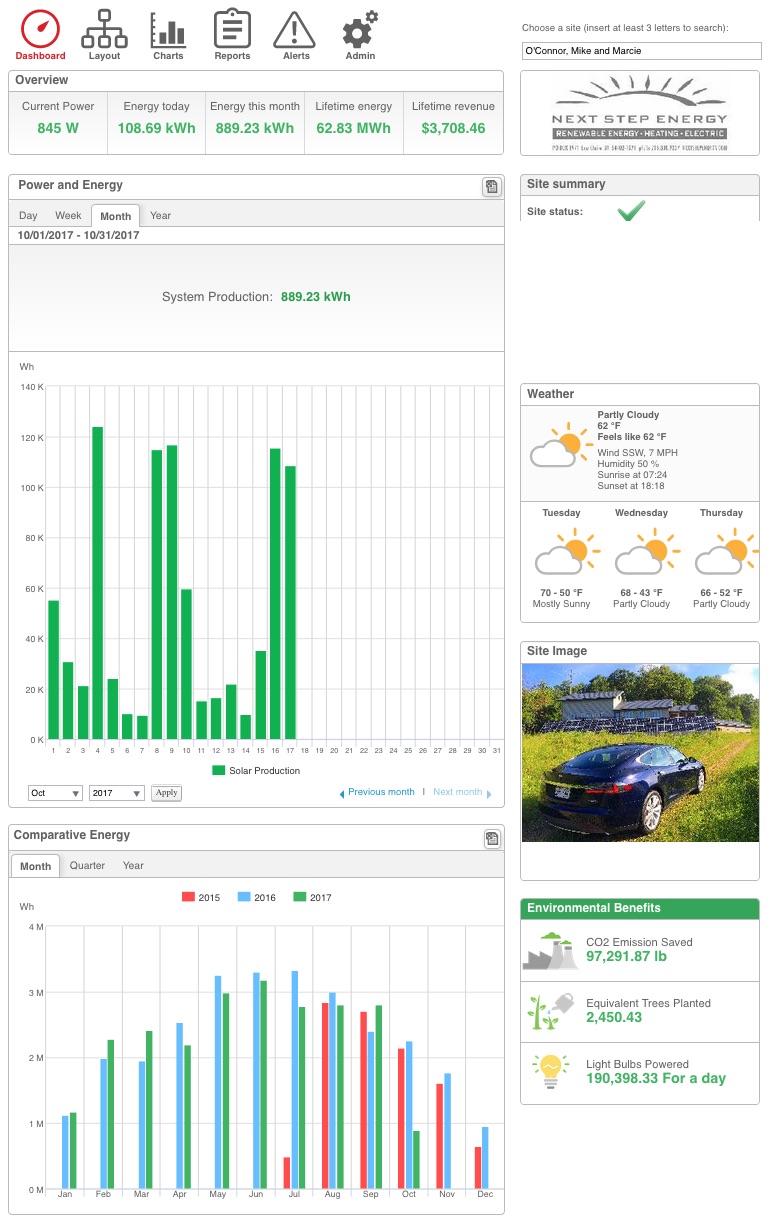
Here’s what shows up on the dashboard from Solar Edge — this is only measuring the power we produce, not consumption. Thus the “revenue” number is kinda wrong because it simply multiplies kilowatt hours produced times a rate per kw/hour. I’ve jiggered the rate to reflect the fact that we produce about half again as much power as we need and we get reimbursed for that at a lower rate. So this revenue estimate isn’t too bad, but kinda wrong.
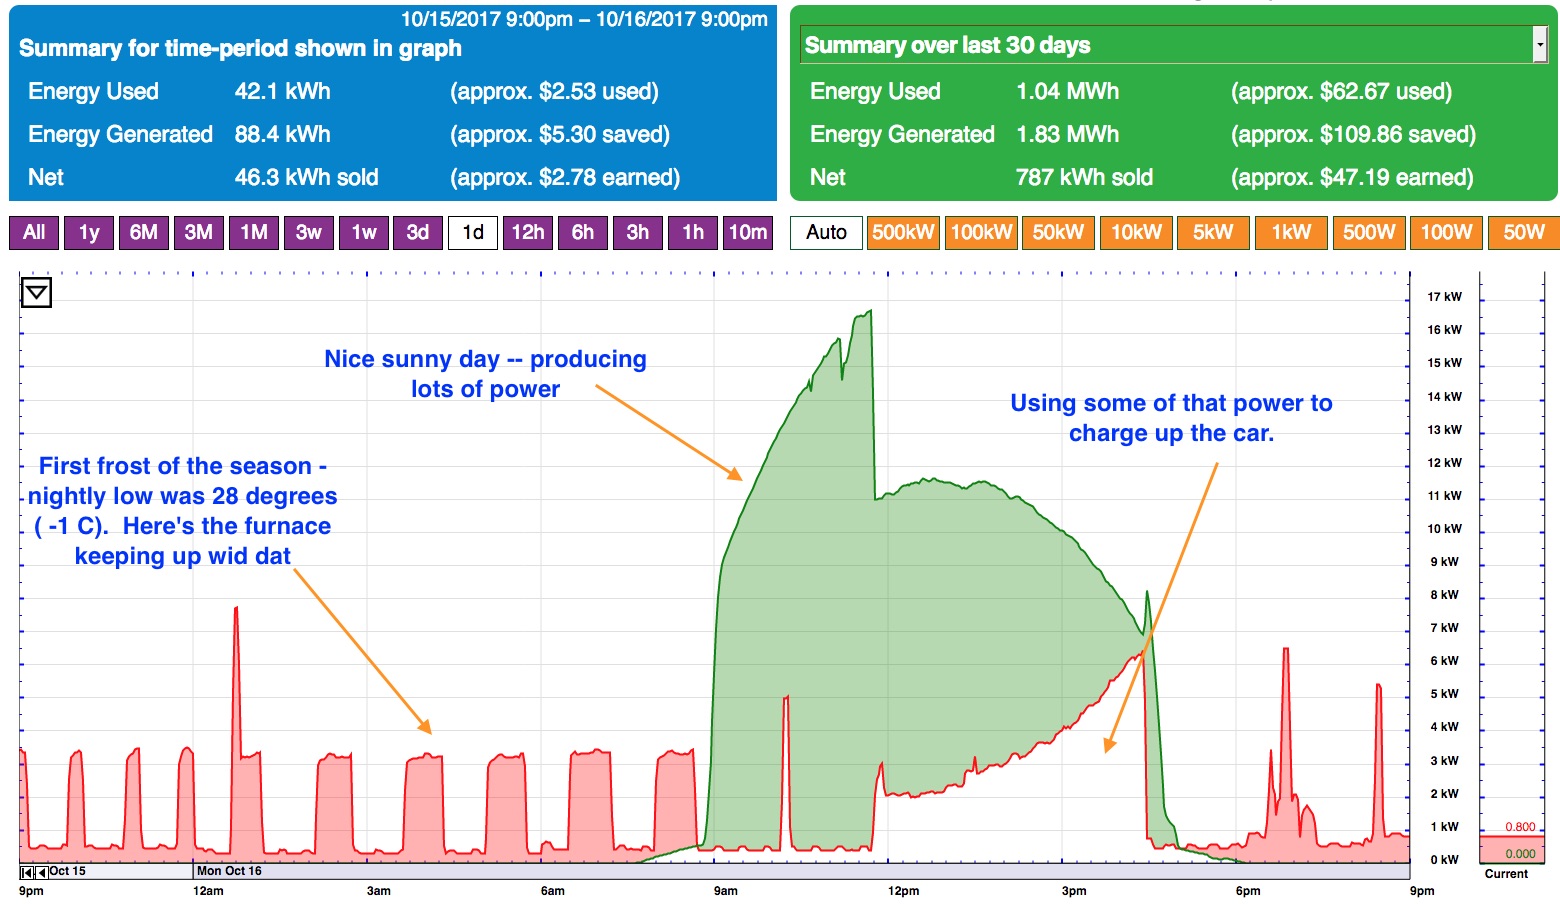
We had a “perfect solar day” yesterday and I built this little one-day chart on top of the dashboard that the eGauge provides. This is a much more accurate monitoring system — so accurate that I use it to monitor Riverland’s meters. Over a few months these numbers match Riverland pretty much on the nose (easily within 1 percent).
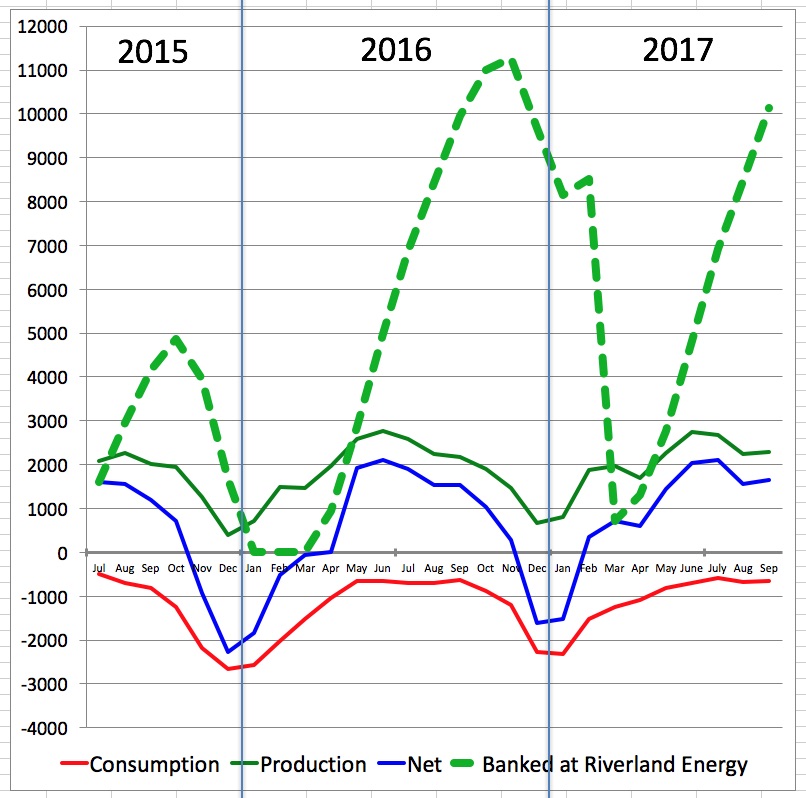
Here’s a graph that I update every month to keep track of consumption, production, net power generated/consumed and the “bank” of excess power that we have at Riverland. As you can see, we produce about one and a half times as much power as we consume, so every March Riverland resets our “bank” to zero and credits our bill for that power. We view them as a huge battery that time shifts our excess power from summer to winter and are grateful that they do that. 2015 was a partial year, so the bank didn’t get nearly as big as it did in 2016. We’re on pretty much the same pace this year so I’m expecting about the same 8500 kw/hours of excess come March of 2018. Our credit from Riverland in 2016 was about $250. Update: March 2024: we’re pretty close to net-zero now.